Serverless Observability at Near-Zero Cost with an Existing Grafana Stack
I had a serverless planning poker app running on AWS (Lambda, API Gateway WebSocket, DynamoDB) costing $0.50/month. It worked, but I was flying blind. No idea how many rooms were created, how many votes were cast, which card scales people preferred.
The constraint: I already have Prometheus, Loki, and Grafana running on a k3s cluster. I did not want to add CloudWatch dashboards, set up a separate Grafana Cloud instance, or deploy any new AWS infrastructure. I wanted the metrics in my existing stack, with no meaningful additional cost.
What the “near-zero” claim depends on
Before going further, the cost story only holds under specific conditions:
- An existing Grafana/Loki/k3s stack is already running and paid for
- Log volume is low (kilobytes per month, not gigabytes)
- CloudWatch Logs Insights scan volume stays within the negligible range
- No near-real-time alerting requirement (15-minute polling lag is acceptable)
- No new paid AWS resources or SaaS services are introduced
If any of these assumptions don’t apply to your situation, the pattern still works but the cost calculation changes. CloudWatch Logs ingestion, archive storage, and Logs Insights scanning are all billable after the free tier, and pricing varies by region.
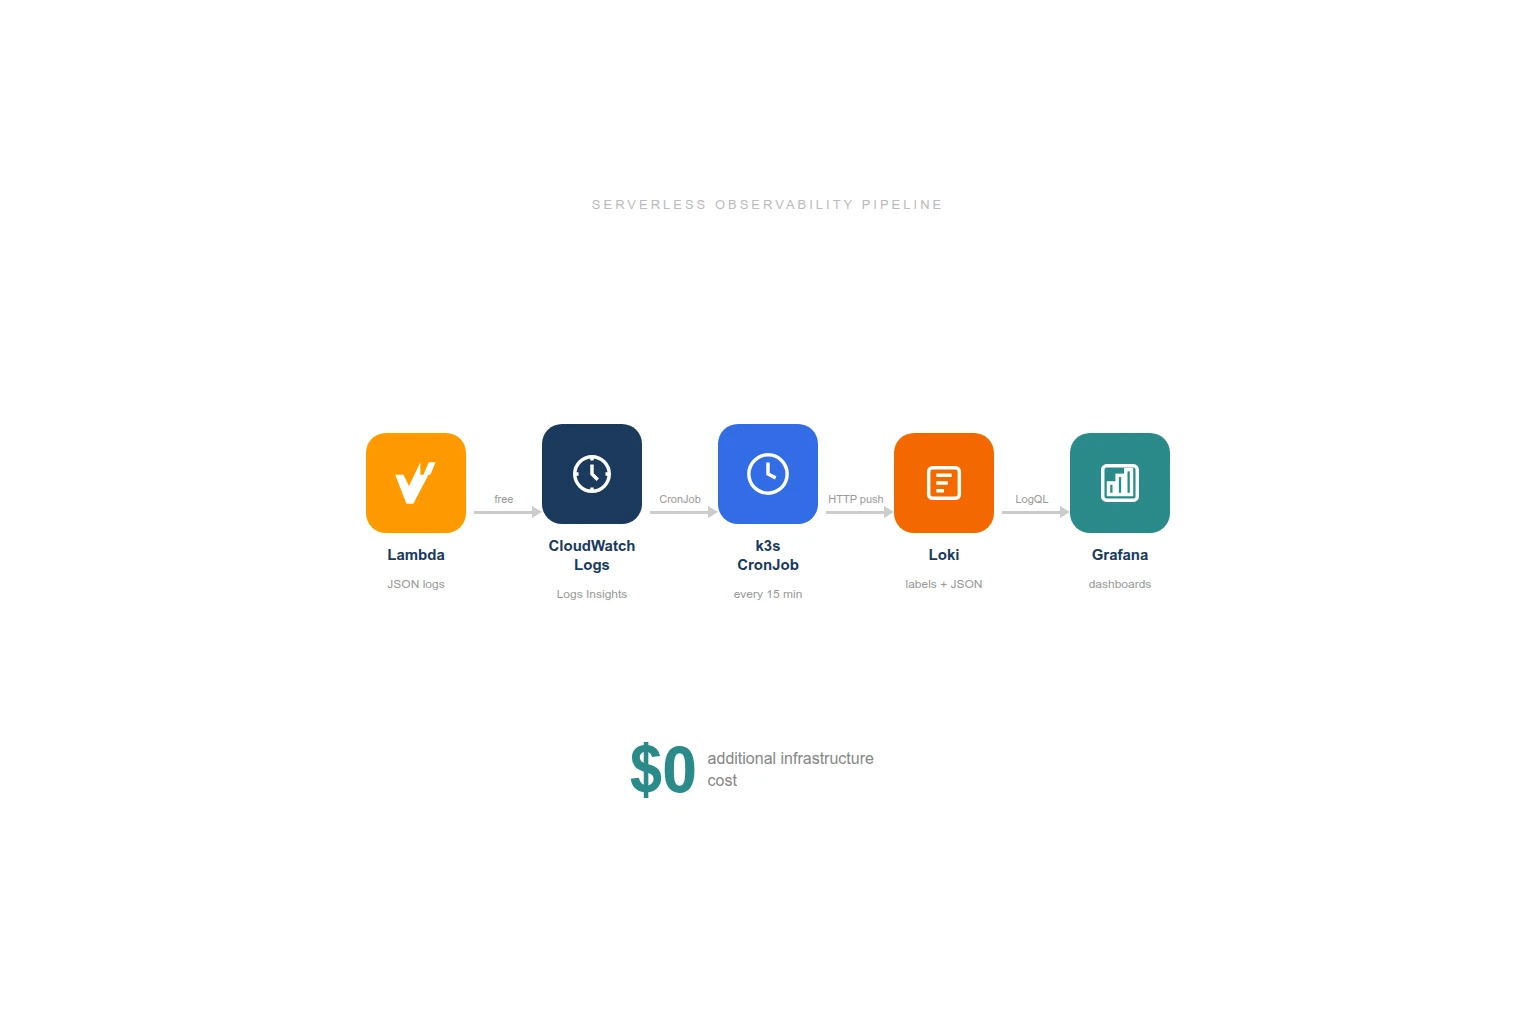
The Pattern: Structured Logs + CronJob + Loki
The approach is straightforward:
- Lambda writes structured JSON logs to CloudWatch (which it already does for free under the basic execution role)
- A k3s CronJob queries CloudWatch Logs Insights every 15 minutes
- Parsed events get pushed to Loki with appropriate labels
- Grafana dashboards query Loki for totals, trends, and distributions
No new AWS resources. The CronJob pattern already existed in my cluster for AWS cost tracking and CloudFront log ingestion. I added another one.
Step 1: Structured Logging in Lambda
Every business event gets a one-line console.log with a JSON payload:
// After room creation
console.log(JSON.stringify({
  m: 'agilepoker',
  event: 'create-room',
  roomCode: 'happy-tiger',
  cardScale: 'fibonacci'
}));

// After a vote
console.log(JSON.stringify({
  m: 'agilepoker',
  event: 'submit-vote',
  roomCode: 'happy-tiger',
  vote: '8'
}));
The m: 'agilepoker' field is a marker that lets me filter for my events reliably in CloudWatch Logs without matching random Lambda runtime messages.
Six events are logged:
| Event | When | Fields |
|---|---|---|
create-room | Room created | roomCode, cardScale |
join-room | Participant joins | roomCode, isSpectator |
submit-vote | Vote submitted | roomCode, vote |
reveal-votes | Votes revealed | roomCode |
reset-votes | New round started | roomCode |
disconnect | Participant leaves | roomCode, remaining count |
These logs cost nothing extra. Lambda already writes to CloudWatch Logs as part of AWSLambdaBasicExecutionRole. The structured JSON adds a few bytes per invocation.
Step 2: The CronJob
I already had two CronJobs in my monitoring namespace:
aws-costs-to-lokifor daily Cost Explorer queries pushed to Lokicloudfront-to-lokifor CloudFront access logs from S3 pushed to Loki every 10 minutes
The new CronJob follows the same pattern: python:3.12-slim image, inline script, pip install boto3 at runtime, push to Loki’s HTTP API.
# CloudWatch Logs Insights query
query = """
fields @timestamp, @message
| filter @message like /"m":"agilepoker"/
| sort @timestamp asc
| limit 1000
"""

response = logs.start_query(
    logGroupName="/aws/lambda/agilepoker-websocket",
    startTime=start_time,  # 20 minutes ago (overlap for safety)
    endTime=end_time,
    queryString=query,
)
The script:
- Runs a Logs Insights query over the last 20 minutes (5-minute overlap with the 15-minute schedule to avoid gaps)
- Extracts the JSON from each log line (Lambda formats them as
timestamp requestId INFO {json}) - Groups events by type
- Pushes to Loki with labels
job=agilepokerandevent=<type>
Each event becomes a Loki log entry with the original CloudWatch timestamp, so Grafana shows the actual event times, not the CronJob execution time.
Security and operational considerations
A few things matter for a production-grade version of this pattern:
The IAM credentials used by the CronJob should follow least-privilege: only logs:StartQuery, logs:GetQueryResults, and logs:StopQuery on the specific log group. My CronJob reuses the same IAM user as the CloudFront log ingestion, scoped to the actions it actually needs.
Loki push authentication is handled through a Kubernetes Secret mounted into the CronJob pod. The Loki endpoint is internal to the cluster (ClusterIP), so no external exposure.
The 5-minute overlap between query window and schedule means some events may be fetched twice. Loki handles this gracefully because entries with the same timestamp and content are deduplicated. If your target system doesn’t deduplicate, add a seen-set or use the CloudWatch @ptr field as a deduplication key.
When the CronJob fails (network issue, Loki down, credentials expired), you get a gap in your data. For a dashboard this is acceptable. For production alerting, it isn’t. The CronJob has restartPolicy: OnFailure, and I have a Prometheus alert on CronJob failures across the cluster.
Retention is worth thinking about: CloudWatch Logs default to never-expire, which can accumulate storage costs. I set log group retention to 30 days. Loki retention is 90 days, which is enough for trend analysis.
Label cardinality matters for Loki performance. I use only two labels (job and event), keeping the label set small. Putting roomCode as a label would create thousands of streams and degrade Loki query performance. Instead, roomCode stays in the log payload and gets extracted at query time with | json.
Step 3: Loki Labels and Querying
The push format follows Loki’s HTTP API:
{
  "streams": [
    {
      "stream": { "job": "agilepoker", "event": "create-room" },
      "values": [
        ["1740498804319000000", "{\"event\":\"create-room\",\"roomCode\":\"happy-tiger\",\"cardScale\":\"fibonacci\"}"]
      ]
    }
  ]
}
The event label is indexed by Loki, so filtering by event type is fast. The JSON payload inside each log line is parsed at query time with | json, with no indexing overhead for business fields like roomCode or cardScale.
Step 4: The Grafana Dashboard
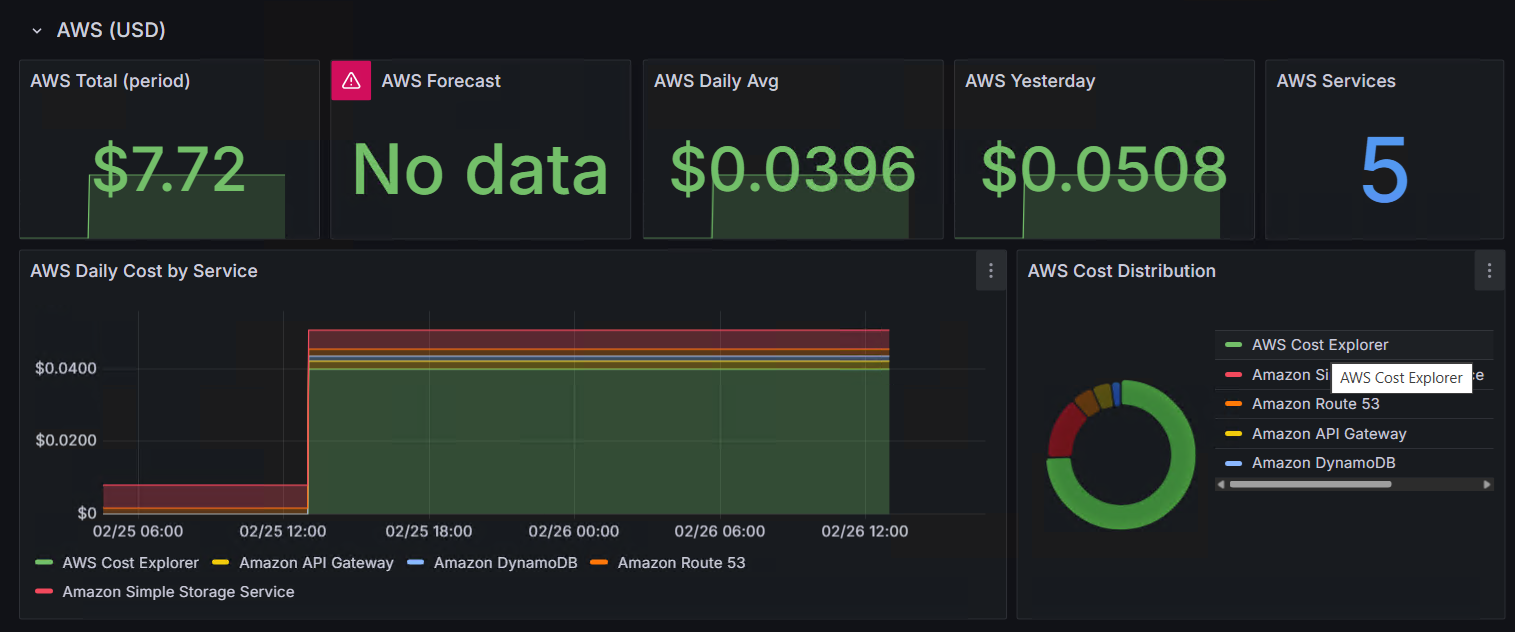
The screenshot above is actually my AWS cost tracking dashboard, not the poker app. I’m showing it because it demonstrates the same pattern applied to a different data source: a CronJob pulls data from an AWS API, pushes it to Loki, and Grafana turns it into panels. The poker dashboard uses the same approach with different queries.
With structured events in Loki, the dashboard queries are straightforward LogQL:
Stat panels for totals:
count_over_time({job="agilepoker", event="create-room"} [$__range])
count_over_time({job="agilepoker", event="submit-vote"} [$__range])
Time series for activity over time:
sum by (event)(count_over_time({job="agilepoker"} [1h]))Pie chart for scale popularity:
sum by (cardScale)(count_over_time({job="agilepoker", event="create-room"} | json [$__range]))Vote distribution:
sum by (vote)(count_over_time({job="agilepoker", event="submit-vote"} | json [$__range]))Cost Analysis
| Component | Cost | Assumption |
|---|---|---|
| Lambda structured logging | $0 | CloudWatch Logs included in basic execution role |
| CloudWatch Logs storage | ~$0 | Kilobytes per month, within free tier (5 GB) |
| CloudWatch Logs Insights | ~$0 | $0.005/GB scanned, logs are kilobytes |
| CronJob on k3s | $0 | Already running cluster, 50m CPU / 64Mi RAM, 5 seconds every 15 min |
| Loki storage | $0 | Already running, marginal additional entries |
| Grafana dashboard | $0 | Already running |
At this scale, the cost is genuinely negligible. At higher log volumes (gigabytes per day), the Logs Insights scan cost alone could reach several dollars per month. Factor that in before applying this pattern to a busy production workload.
When to Use This Pattern (and When Not To)
Use this pattern when you have low-volume business events from a serverless app, an existing Grafana/Loki stack, and no need for real-time alerting. It works well for internal tools, side projects, and small-scale production apps where you want business-level insight without adding new services.
Use native CloudWatch dashboards or alarms when you need faster alerting (seconds, not minutes), simpler operational ownership, or when the team already lives in the AWS console.
Move to streaming (CloudWatch Logs subscriptions to Kinesis or Lambda) when log volume rises to the point where Logs Insights scan costs become meaningful, or when you need near-real-time processing.
Use metrics instead of logs when the signals are stable, high-frequency, and well-defined. Prometheus CloudWatch Exporter gives you Lambda invocations, durations, errors, API Gateway connection counts, and DynamoDB consumed capacity. Those are infrastructure metrics. Structured logging captures business events that metrics can’t express: “which card scale is most popular” or “how many spectators join per room.”
Why This Matters Beyond AWS
The specific tools here are AWS and Loki, but the principle is cloud-agnostic: emit structured business events from your application code, route them into the observability platform you already operate, and avoid introducing another analytics silo unless the requirements justify it.
In Azure environments, the same thinking applies. Application Insights, Log Analytics, and Azure Monitor can serve as the structured event store. If you already run Grafana (many Azure enterprises do, especially through Azure Managed Grafana), the integration path is similar: query the log store on a schedule or via data source plugin, build dashboards on top.
The broader lesson is about platform reuse. Every new monitoring tool, every new dashboard product, every new SaaS subscription adds operational surface area. Before reaching for a new tool, check whether your existing platform can answer the question with a small script and some structured logs. Often it can.
The Reusable Pattern
- Add structured JSON logging to your functions (one line per business event)
- Deploy a CronJob that queries your cloud log store
- Push to your existing log aggregation system
- Build dashboards on top
The CronJob is a ~60-line Python script. The structured logging is a console.log per event. The Grafana dashboard is a JSON file. Total implementation time was under an hour.
The same pattern powers my cost tracking (AWS Cost Explorer to Loki), CDN monitoring (CloudFront logs to Loki), and now application metrics. Three CronJobs, one Loki instance, one Grafana.