When Your FinOps Tool Becomes Your Biggest Cost: The AWS Cost Explorer Trap
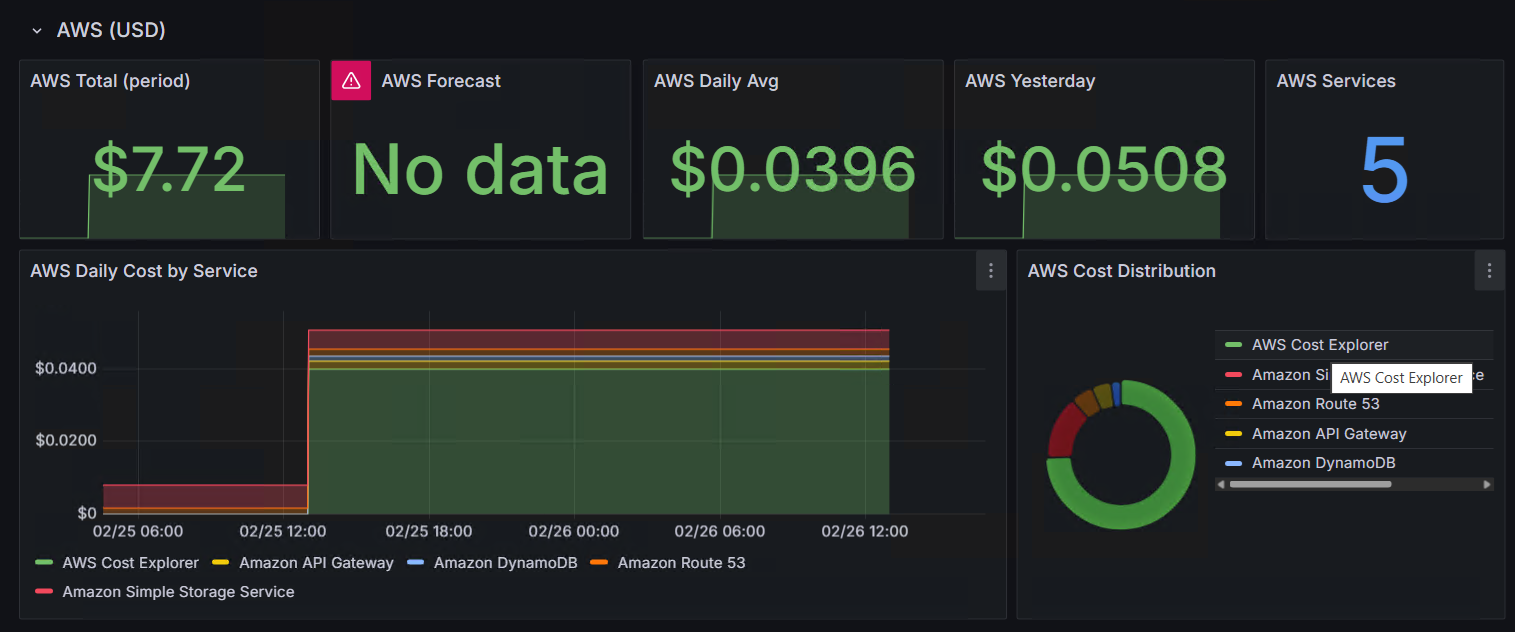
Look at that pie chart. The green slice dominating the cost distribution? That’s AWS Cost Explorer, the API I was calling to track my costs. The tool meant to save money was the most expensive thing running.
The Setup
I run a small k3s cluster at home with a few AWS services. Route 53 handles DNS, DynamoDB backs my serverless planning poker app, and there’s an API Gateway and S3 bucket alongside it. Total monthly cost is well under a dollar.
I already had a full observability stack pulling CloudWatch logs and CloudFront metrics into Grafana via Loki. Adding AWS cost tracking felt like the natural next step, so I built a CronJob that queries the Cost Explorer API and pushes daily breakdowns to the same Loki instance. Standard FinOps practice. What could go wrong?
The Problem: $0.01 Per API Call
AWS Cost Explorer charges $0.01 per API request. That doesn’t sound like much until you look at what my CronJob was actually doing:
Schedule:          daily at 07:00 UTC
Lookback window:   29 days
Group by:          SERVICE (daily granularity)
Pagination:        yes (large responses get split)
Forecast call:     yes (separate API request)
Every single day, the job would:
- Call
GetCostAndUsagewith a 29-day window, potentially paginated into multiple requests - Call
GetCostForecastfor the current month, another billable request
At minimum 2 API calls per day, often more with pagination. That’s 60+ requests per month at $0.01 each, or $0.60/month just to monitor $0.50/month in actual AWS usage.
After just two days, Cost Explorer had already racked up $7.72 and was the single largest line item in my AWS bill. The monitoring was 15x more expensive than everything it was monitoring.
The Fix
Three changes, all obvious in hindsight.
1. Weekly Instead of Daily
Cost data doesn’t change that fast. A weekly check on Monday morning gives you the same insights with 7x fewer API calls.
schedule: "0 7 * * 1" # Monday at 07:00 UTC2. Smaller Lookback Window
Fetching 29 days of history every run meant re-fetching data I already had in Loki. Since the planning poker app and its surrounding services barely change in cost from day to day, a 7-day window covers exactly one week of new data since the last run.
start = today - timedelta(days=7) # was 293. Drop the Forecast
The GetCostForecast API call was another $0.01 per invocation, and the forecast for a sub-dollar monthly bill is not exactly actionable intelligence.
Result: roughly 4 API calls per month, $0.04/month. A 95% cost reduction on the monitoring itself.
The Alternative I Considered
AWS publishes EstimatedCharges metrics in CloudWatch Billing (us-east-1 region) every 6 hours, broken down by service. The CloudWatch GetMetricData API is free for basic usage with 1M requests/month included. That would bring the monitoring cost to exactly $0.00.
The tradeoff is that you only get month-to-date totals, not daily granularity. For a home lab bill that’s more than enough. For production workloads where you need daily breakdowns by service, Cost Explorer at a weekly cadence is the pragmatic middle ground.
The Lesson
The AWS Cost Explorer API is designed for enterprise accounts spending thousands per month. At that scale, $0.01 per request is a rounding error. At hobby scale, it can easily become your largest cost.
Before automating cost visibility:
- Check the API pricing of your monitoring tool itself
- Minimize call frequency, weekly is fine for cost data
- Minimize the data window, don’t re-fetch what you already stored
- Consider free alternatives, CloudWatch Billing metrics cost nothing
Sometimes the cheapest optimization is optimizing the optimizer.